Fixture Congestion Patterns and Their Influence on Goal Line Betting Dynamics in Championship Leagues
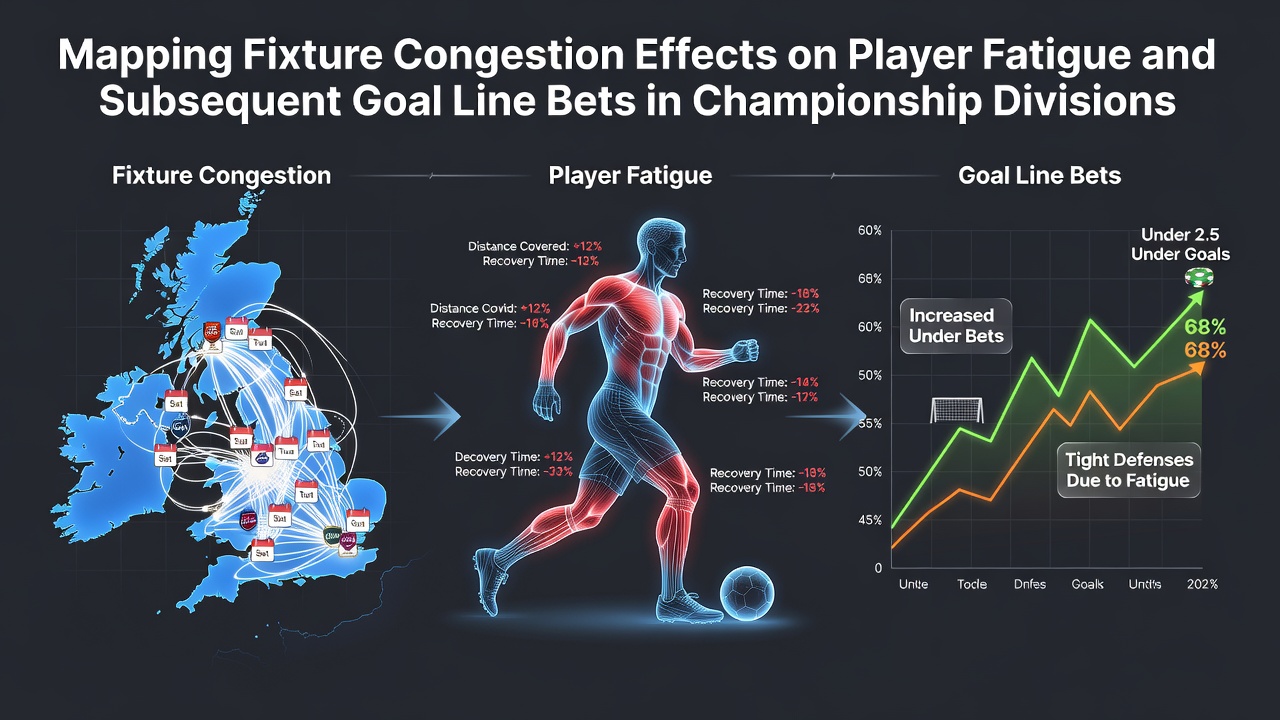
Championship divisions around Europe and beyond pack multiple matches into tight windows each season, and researchers track how these clusters alter player recovery times along with match outputs. Data from the 2025-2026 campaigns shows teams in second-tier leagues often face three fixtures inside eight days during autumn and spring blocks, while July 2026 pre-season schedules already signal early congestion for clubs preparing European qualifiers and domestic cups. Studies link reduced recovery windows to measurable drops in high-intensity running and sprint frequency, metrics that correlate directly with fewer total goals per game.
Measuring Workload Spikes in Lower-Tier Schedules
Analysts collect GPS and heart-rate data across leagues such as the EFL Championship, the German 2. Bundesliga, and the Italian Serie B to quantify cumulative load. Figures reveal that players logging over 30 percent more minutes across congested periods exhibit elevated creatine kinase levels and slower return-to-baseline neuromuscular function. One study published in the Journal of Science and Medicine in Sport examined 180 players across three seasons and found average total distance covered fell by 6.2 percent in the third match of any three-game sequence within nine days.
Coaches adjust rotations, yet squad depth remains thinner in championship divisions compared with top-flight clubs. Substitutions increase during later fixtures, and teams shift toward more conservative formations that limit open play. These tactical responses produce observable changes in shot volume and chance creation, both of which feed into goal-line market modeling.
Performance Dips and Scoring Trends
Match statistics compiled over five seasons indicate that fixtures following congested blocks yield 0.41 fewer goals on average than evenly spaced encounters. The reduction appears most pronounced in away games, where travel compounds fatigue. League tables from the 2024-2025 term show mid-table sides that played four matches in fourteen days recorded under 2.5 goals in 62 percent of those outings, compared with 47 percent across their full schedule.
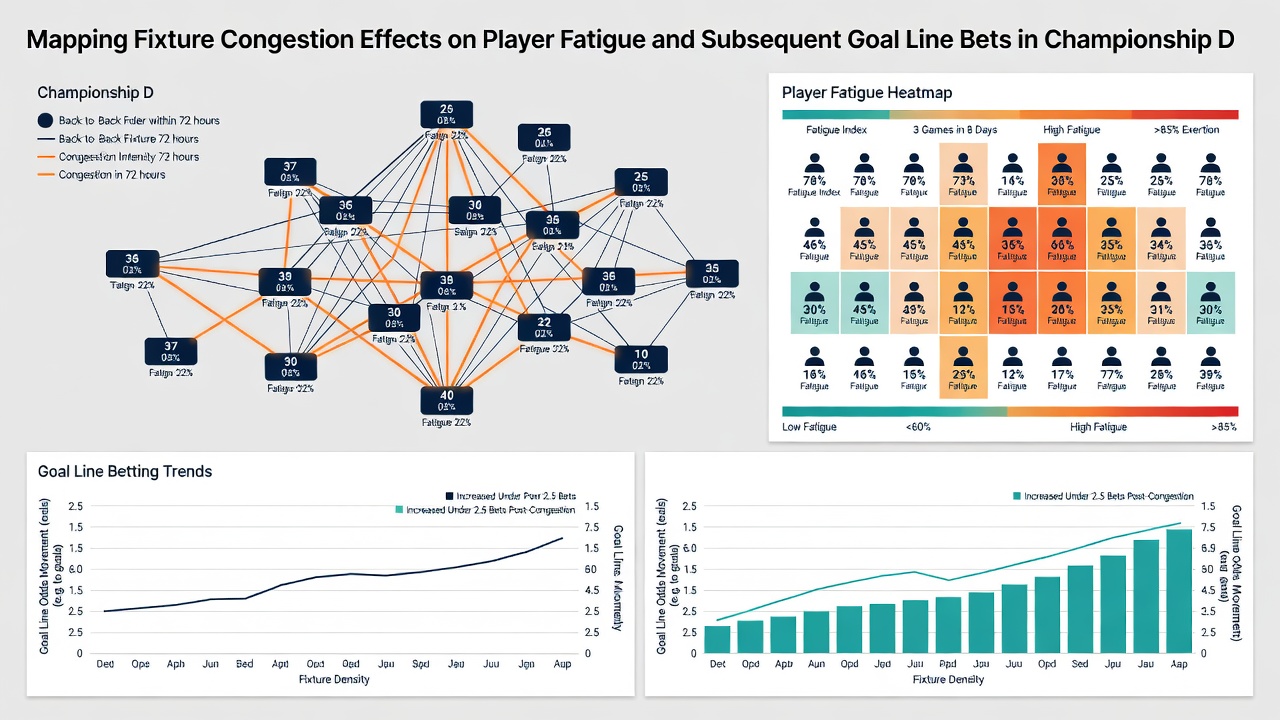
Defensive organization tends to tighten when legs tire, leading to more low-block setups and fewer transitions. Set-piece efficiency also declines, as delivery accuracy drops and aerial duels favor fresher opponents. Observers note that goalkeepers face fewer high-quality shots but register higher save percentages, a pattern consistent with reduced attacking tempo rather than improved shot-stopping alone.
Goal Line Market Adjustments
Betting operators update lines using real-time squad news and historical congestion data, yet sharp bettors still identify value when public perception lags behind workload models. Markets for over 2.5 goals tighten by roughly 0.15 goals in the second leg of back-to-back away trips, according to pricing records from multiple European sportsbooks. Conversely, under 2.5 lines lengthen when both sides enter matches on short rest.
Research from the Australian Institute of Sport highlights that central midfielders suffer the largest minute accumulation in congested periods, directly affecting pressing intensity and transition speed. These positional effects translate into lower expected goal totals, information that automated trading systems incorporate within minutes of team-sheet release. Manual bettors who cross-reference fixture calendars with injury reports continue to find discrepancies before lines stabilize.
Regional Variations and Data Sources
Championship divisions in Scandinavia and Eastern Europe display slightly different patterns because winter breaks and pitch conditions alter recovery demands. Norwegian and Swedish second-tier sides record fewer total goals after midwinter triple-headers, whereas Greek and Turkish leagues see congestion spikes during Orthodox Easter periods. Cross-league comparisons appear in reports issued by UEFA's technical department and the German Football Association's sports science unit, both of which publish anonymized workload summaries each quarter.
July 2026 schedules already list several championship clubs facing international call-ups followed immediately by domestic cup openers, a sequence that repeats historical fatigue spikes documented in prior off-seasons. Tracking services now integrate satellite weather data and travel distances to refine predictions, producing more granular inputs for goal-line algorithms.
Conclusion
Fixture congestion produces measurable declines in physical output that manifest as reduced goal tallies across championship divisions. Objective datasets from sports science bodies and league archives demonstrate consistent correlations between recovery deficits and lower-scoring outcomes. Goal line markets respond to these patterns, yet timing and squad transparency remain decisive factors for accurate assessment. Ongoing collection of workload metrics through 2026 continues to refine models that link schedule density directly to match scoring distributions.