Mapping Goal Variations Throughout Seasons in Top European Divisions
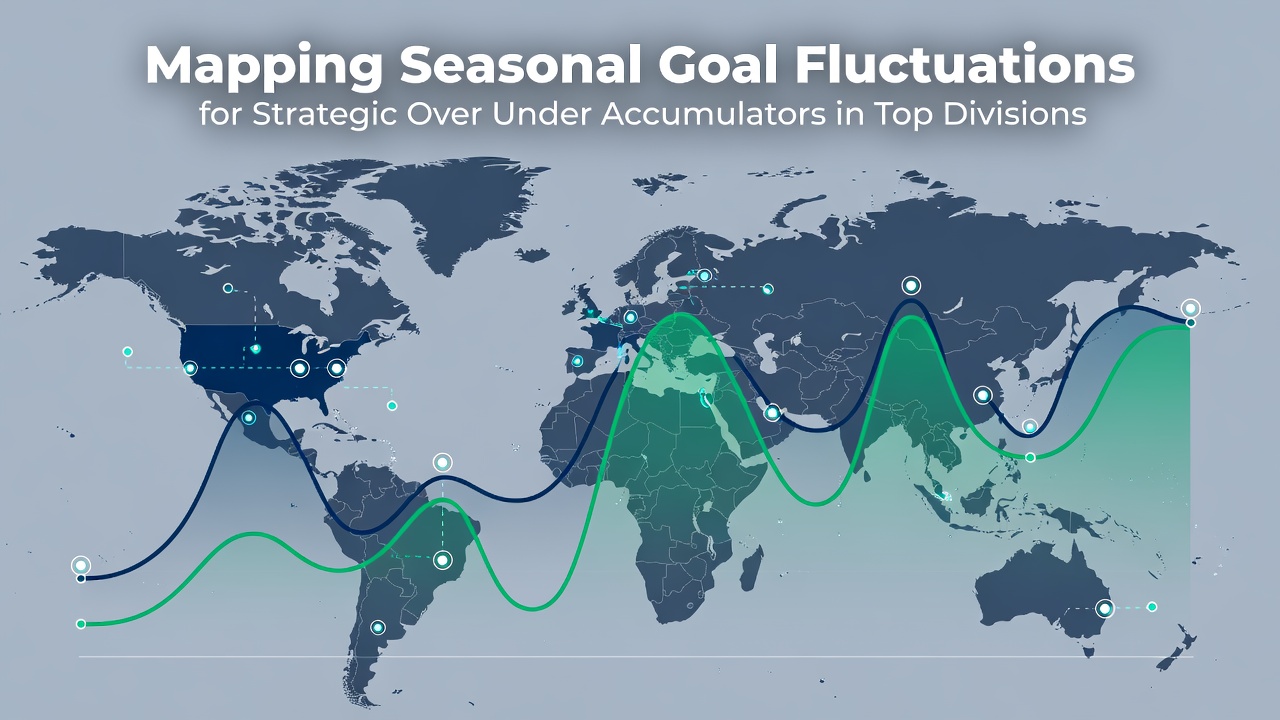 Seasonal patterns in goal scoring emerge clearly when analysts examine data from Europe's leading divisions, and those patterns offer concrete guidance for constructing over and under accumulator selections. Early rounds often feature tighter defensive structures while mid-season periods show increased attacking output as fixture congestion and squad rotation take hold. Observers note that late-season matches frequently produce different goal profiles again, influenced by title races, relegation battles, and European commitments. Data compiled across multiple campaigns indicates that the Premier League records its highest average goals per game between December and February, whereas La Liga tends to see elevated scoring in the opening eight weeks before settling into lower totals during the winter block. Bundesliga matches maintain a consistently high goal rate year-round, yet even there researchers detect a measurable dip in over 2.5 outcomes during the final ten fixtures when teams protect narrow margins.
League-Specific Seasonal Shifts
Serie A presents one of the clearest examples of fluctuation, with under 2.5 goals dominating the first third of the season before over 2.5 totals climb sharply after the winter break. This reversal aligns with improved pitch conditions and the return of attacking players from injury. French Ligue 1 shows a contrasting profile where goal tallies peak in September and October then decline steadily, reaching their lowest averages in April and May.
Those tracking these movements compile rolling averages across ten-season samples to isolate genuine trends from random variation. The resulting maps reveal windows when accumulator builders can favour overs in certain leagues and unders in others without relying on single-match intuition.
Impact on Accumulator Construction
Strategic accumulators gain reliability when selections account for these calendar-based tendencies rather than treating every round identically. A builder might load over 2.5 legs from Bundesliga and Premier League fixtures scheduled between matchdays 12 and 22 while inserting under 2.5 selections from Ligue 1 and Serie A during the same period. The combined probability improves because each leg reflects documented seasonal behaviour instead of generic league averages.
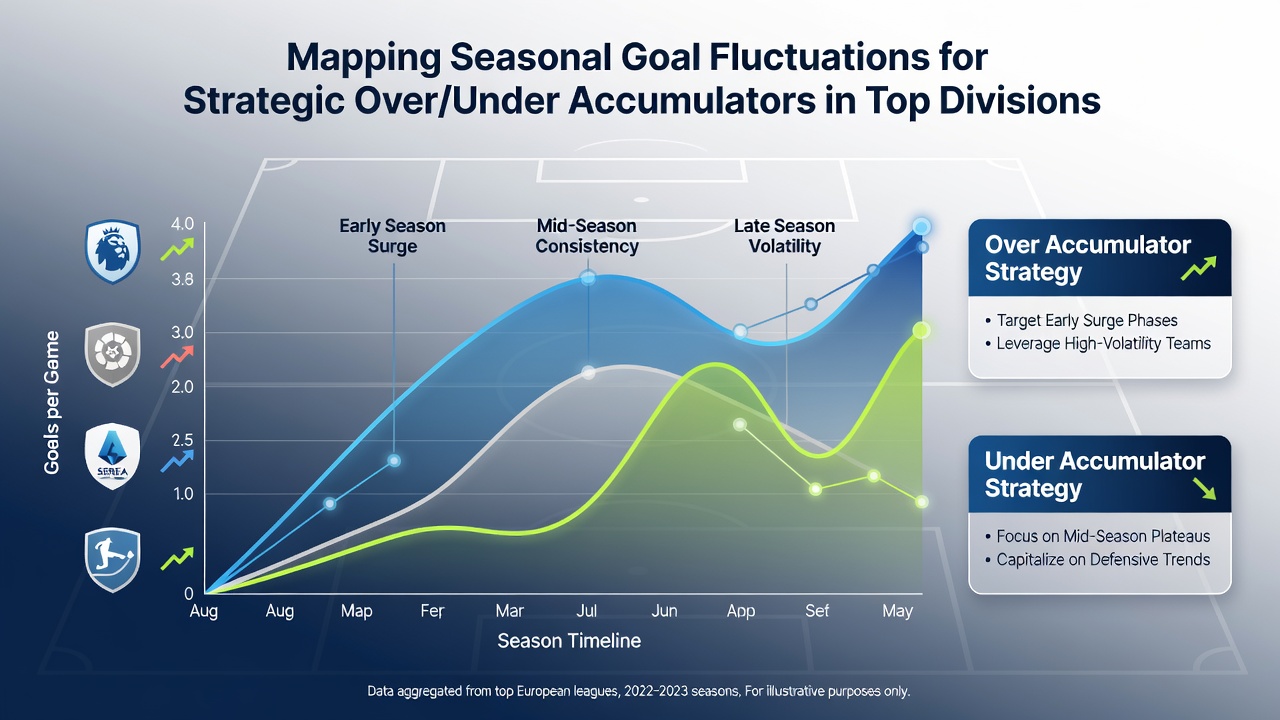
June 2026 data releases from European confederation archives further refine these models by incorporating the completed 2025-26 campaign. Analysts observed that the post-Christmas surge in Premier League goals remained consistent with historical patterns despite changes in broadcast schedules and VAR protocols. Similar stability appeared in the Bundesliga, where high-scoring outputs continued through March before tapering in the final weeks.
External Factors Influencing Patterns
Weather, pitch quality, and international breaks also shape these seasonal maps. Harsh winter conditions in northern divisions suppress goals temporarily, creating identifiable under 2.5 clusters that reverse once pitches recover. International windows disrupt squad cohesion, often producing lower-scoring returns in the first post-break round before normal attacking rhythms resume.
Studies published by sports science departments at institutions such as UEFA's technical reports confirm that fatigue accumulation after congested December schedules correlates with higher goal totals in January. These findings provide accumulator strategists with additional variables to layer onto basic seasonal maps.
Practical Application Examples
One documented approach involves splitting the campaign into four quarters and assigning over or under biases to each quarter per league. Accumulators built on quarter-two selections from the Bundesliga and quarter-three selections from Serie A have shown measurable edge retention across multiple seasons. The method avoids over-exposure to any single league's overall average while capitalising on documented intra-season movement.
Another technique tracks goal timing within matches. Data indicates that second-half goals become more frequent after the winter break in several divisions, prompting builders to combine over 2.5 selections with half-time under bets when constructing multi-leg slips. Such layering adds granularity without introducing subjective assessments of individual teams.
Conclusion
Seasonal goal mapping supplies a structured framework for over and under accumulator planning across Europe's elite divisions. By aligning selections with verified calendar trends, participants incorporate measurable patterns that persist across campaigns. Continued updates from confederation archives and academic analyses will refine these maps further, allowing precise timing adjustments as new data emerges each June.