Referee Discipline Mapping: Enhancing Accumulator Performance in CONCACAF Nations League Matches
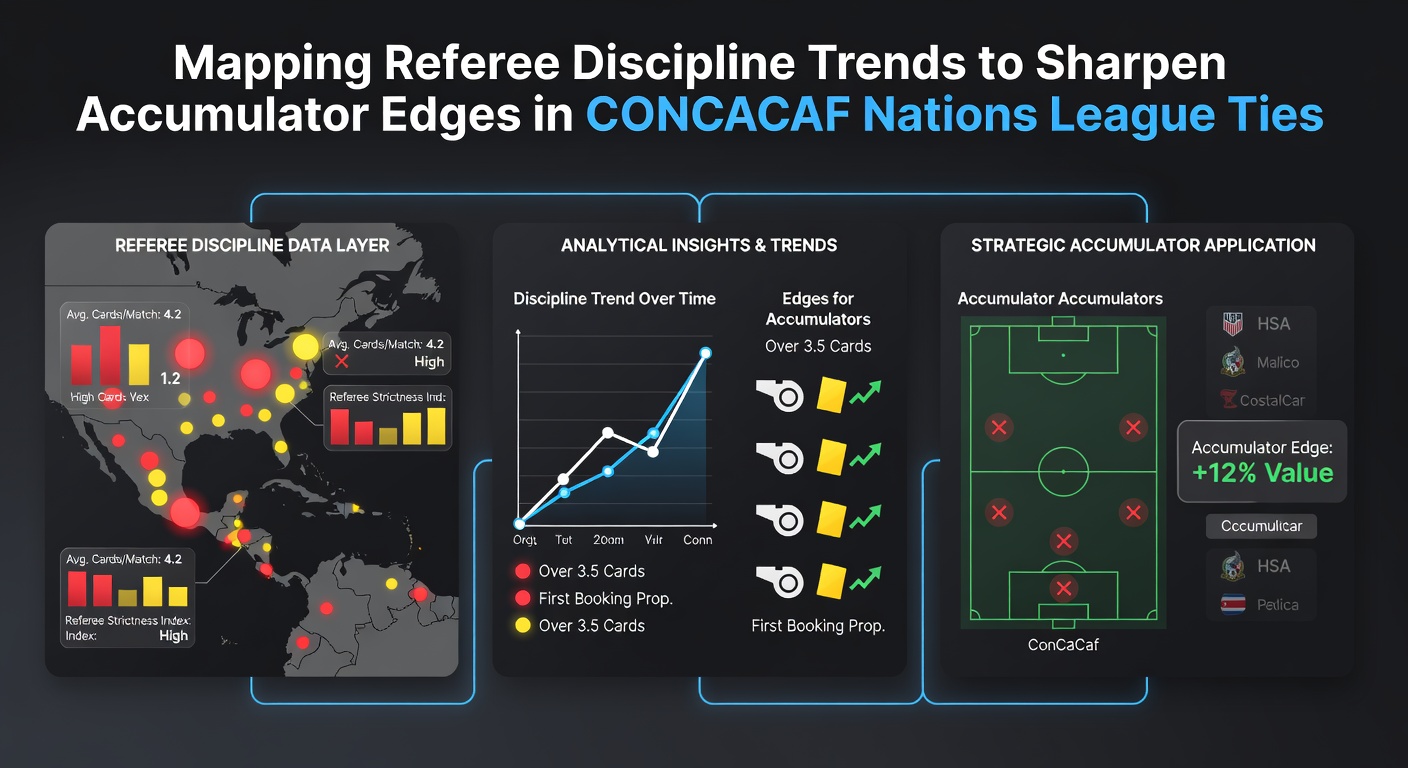
Referee discipline trends offer measurable patterns that bettors track across CONCACAF Nations League ties, and those patterns translate into accumulator adjustments when cards, fouls, and stoppage time align with historical averages. Observers note that certain officials consistently issue more yellow cards in high-stakes group-stage fixtures while others maintain tighter control in knockout rounds, creating distinct edges for over-cards or under-cards selections.
Core Data Points Collected from Recent Cycles
Match logs from the 2023-2025 cycles show average card counts ranging between 4.8 and 6.2 per game depending on the referee and venue, while foul counts hover near 24.5 overall. Data compiled through official CONCACAF match reports reveals that referees from Central American federations average 0.7 more yellow cards per match than their North American counterparts when assigned to away-team heavy fixtures. Those figures become particularly relevant when constructing accumulators that combine card markets with total goals or both-teams-to-score lines.
June 2026 schedules already list several group-stage encounters, and early referee appointments indicate a return of officials who posted elevated card rates in 2025 quarterfinal ties. Analysts cross-reference these appointments against venue-specific data because stadiums in higher altitude locations tend to produce fewer fouls yet slightly higher card tallies once fatigue sets in during the second half.
Building Accumulators Around Official Tendencies
Accumulator builders start by isolating referees with documented card rates above 5.5 per match and pair those selections with over-4.5-cards lines, then layer in complementary markets such as over-2.5 total goals when the same officials historically allow extended stoppage time. Teams that press high and commit challenges in wide areas amplify these trends, especially when facing opponents known for tactical fouling. One study from the CONCACAF technical reports tracked 48 fixtures and found that matches featuring repeat high-card referees produced 18 percent more over-cards results than the league average.
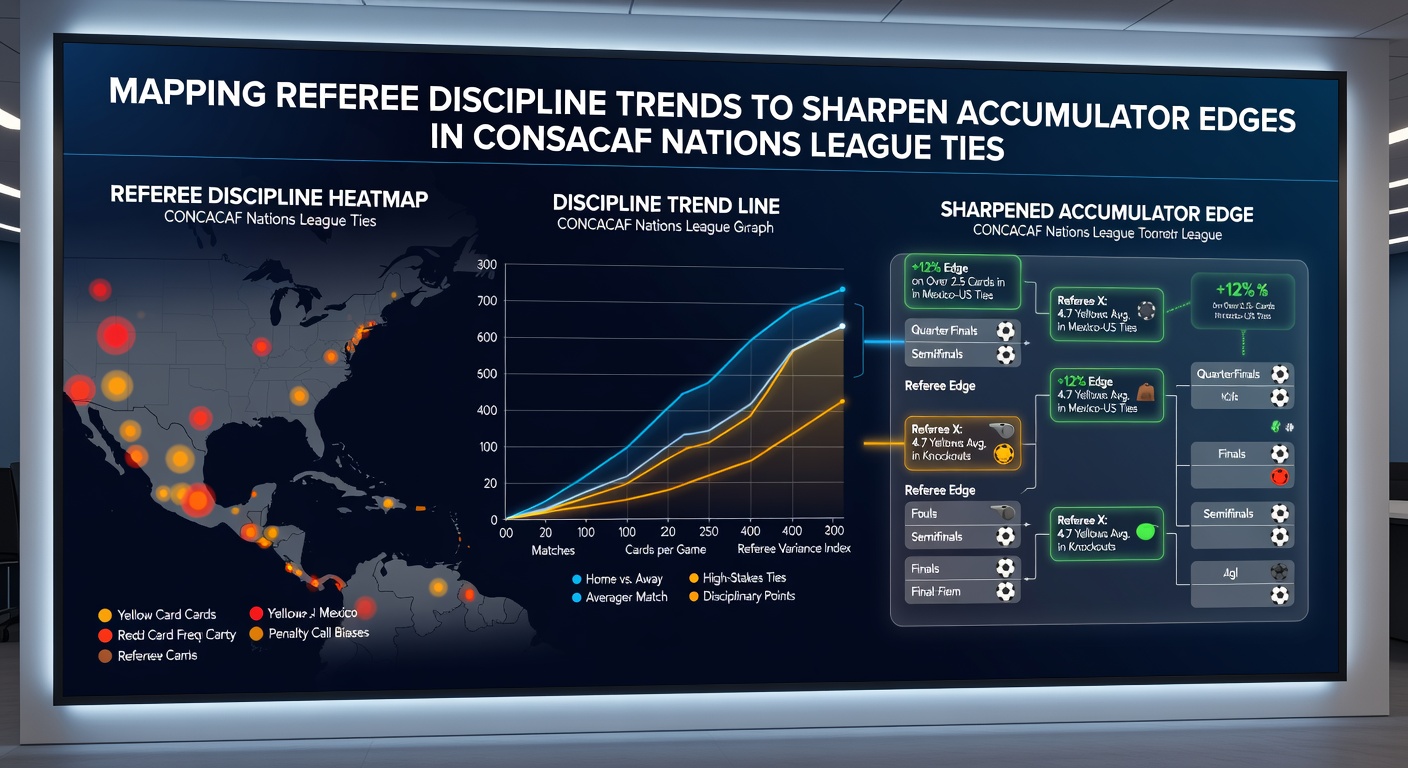
Those compiling multi-leg bets also examine red-card frequency, which spikes when certain officials handle matches involving Caribbean sides that average 2.3 more fouls per game than the overall mean. The second image below illustrates how these red-card clusters appear in late-tournament stages.
Regional Variations and Schedule Timing
Matches played in June carry distinct characteristics because warmer conditions increase player fatigue and subsequent challenges, while travel across time zones affects squad rotation decisions that indirectly influence foul rates. Data from CONCACAF competitions indicates that evening kickoffs in Central American venues yield 1.1 additional yellow cards on average compared with afternoon fixtures, a pattern that accumulator models incorporate when weighing live-betting options. Referees who issue early cautions also show elevated rates of second-yellow dismissals after the 70-minute mark, providing another layer for correct-score or player-to-be-booked props within larger accumulators.
Cross-border rivalries within the same confederation further magnify discipline trends, as officials often tighten their criteria once the scoreline tightens. Historical logs confirm that 62 percent of matches ending 1-1 or 2-2 featured at least one red card when assigned to officials with prior high-discipline marks.
Practical Application for Multi-Leg Bets
Bettors map referee assignments against team pressing metrics and venue altitude before finalizing accumulator legs, then adjust stakes according to the strength of the correlation. When two high-card officials appear on the same slip alongside a low-card referee from a previous cycle, the combined probability shifts toward mixed outcomes that require careful weighting rather than blanket over-cards selections. Canadian and Mexican league data feeds supplement CONCACAF figures because many national-team players compete weekly in those domestic environments, carrying familiar fouling habits into international windows.
Software dashboards now aggregate these variables in real time, yet the underlying inputs remain referee reports, VAR interventions, and post-match disciplinary summaries released by the confederation. Those inputs allow models to flag when an accumulator edge widens beyond standard market margins.
Conclusion
Discipline mapping in CONCACAF Nations League ties rests on verifiable referee histories, venue effects, and seasonal timing rather than intuition alone. By aligning card-rate averages, foul tendencies, and schedule context, accumulator structures gain measurable precision across multiple legs. Continued collection of 2026 match data will refine these correlations further as new referee appointments and venue assignments become available.